
Using Tabs on Multi-View Reports
A few reports pack several related views behind tabs on one page instead of separate report links:
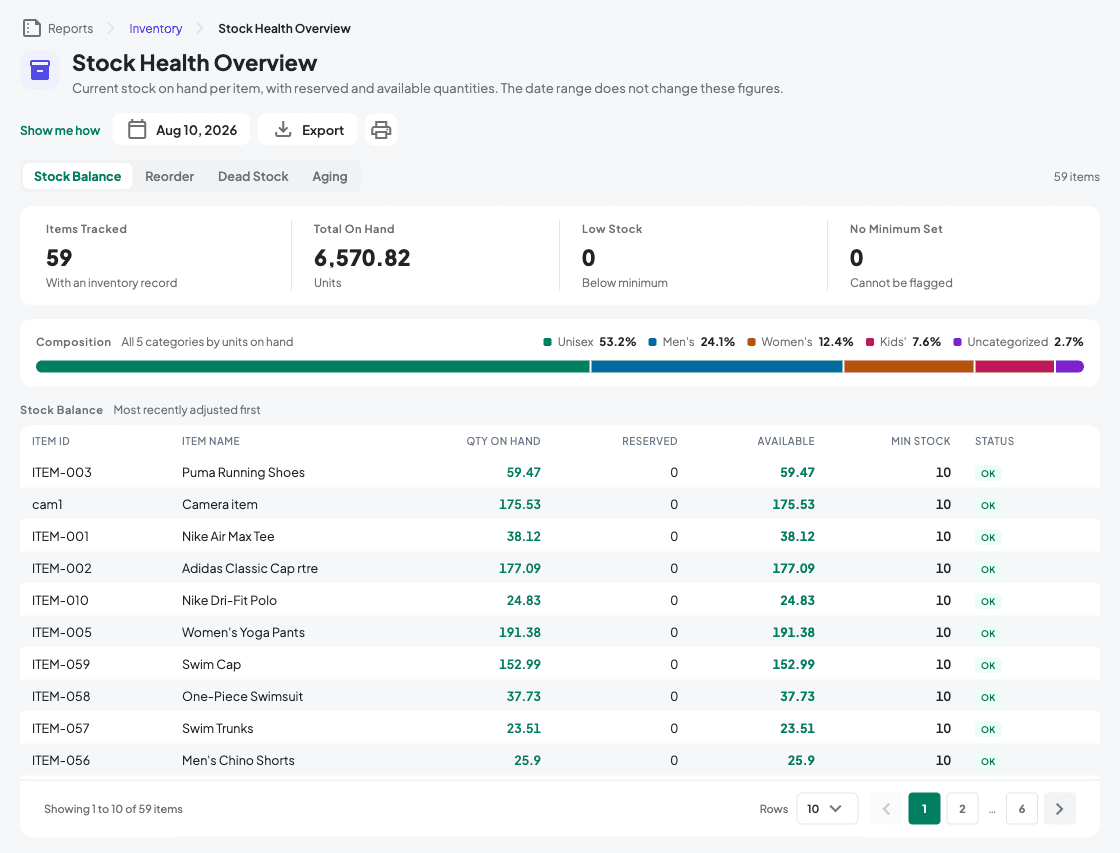
- Open Stock Health Overview (Reports > Inventory > Stock Health Overview). It has Stock Balance, Reorder, Dead Stock, and Aging tabs. Stock Balance is a real-time snapshot (no date range needed); the other three are scoped by the date/as-of control. When items are below their reorder point, a red banner above the table shows how many.
- Open Operational Audit (Reports > Audit > Operational Audit). It has Transactions, Inventory Changes, and Session Log tabs, each with its own columns and its own date range. Only the Transactions tab currently has a PDF export.
- Open Cash & Exception Audit (Reports > Audit > Cash & Exception Audit). It has Discounts, Voids, and Cash Drawer tabs. The Discounts tab lists every sale that went out with a discount on it — when, which order, how much came off, what percentage that was, and the salesperson who applied it. Two things to read correctly: Approved By is blank on every row, because the product does not have a discount-approval step yet, so the "Unapproved" figure counts all discounts rather than flagging rule-breakers; and the Voids tab is always empty, because there is no action anywhere in the product that voids or cancels a completed sale — a sale is reversed by filing a return, which shows on Reports > Transactions instead.
- Switch tabs whenever you like — this keeps your date range, but reloads the data and resets you to page 1 of the table.
- Each tab brings its own set of figures, its own Composition band, and its own table columns, because each tab answers a different question. The count on the right of the tab row ("59 items") tells you how many rows the current tab holds in total, not just on this page.
Next: Taking the Guided Tour.